MAKING PHYSICIAN ANALYTICS ACTIONABLE: BREAKING DATA DOWN BY DRG
- Natasha Hagemeyer, PhD
- 02/9/2023
Most physicians are high performers, competitive, and more than willing to receive feedback if it will make them a better physician. Most see feedback exactly as James Clear suggests above — as a gift.
Feedback is only useful, however, if it's within a physician’s power to control. Actionability is crucial.
The downside of data
That’s why physicians are often so frustrated with the much of the data they receive about their practice. Case in point? Length of stay. If an administrator tells a physician that their patients’ length of stay is higher than everyone else’s, that is an interesting data point, but what are they supposed to do about it? Where would they even begin to look to make changes? These types of metrics include ALL their patients, and for something like length of stay, there are very different practice changes a physician might make if they knew clinical conditions were driving their performance.
Taking our own medicine
Some of the metrics we provided were broad. We wanted to ensure that physicians would have familiar data to use as touchstones when digging into their practice patterns. But we saw that physicians were not able to determine how to change their practice in response to broad metrics. They needed more and asked us to help them understand what was driving their performance on the metric. The big question physicians have is, “Where do I differ from my peers? For some clinical conditions, I might be doing better, in others, not so well. But I can’t see that when I get one score to cover all those various scenarios!”
At Agathos, we pride ourselves in taking the same advice we give physicians — when we receive feedback from physicians, we’re committed to improving the data we provide. Our goal is always to give physicians the tools they need to have the best practice they can, so there’s no reason to get attached to the way we do things if it is not working.
Physicians wanted actionability with their broad metrics. We were determined to provide it.
Our first attempt
We started with one of our broadest metrics, Length of Stay. The quick solution was obvious: simply break out the insight by clinical condition or “DRG.” For example, for patients with gastrointestinal hemorrhage, show each physician what their length of stay is compared to peers.
But providing feedback on one condition at a time was mind-numbingly slow, and some physicians either had too few patients or had no opportunity to improve on that particular condition. For example, even if they knew they were doing great with gastrointestinal hemorrhage patients, they would not have any idea why their overall length of stay was so high.
Real solutions
After extensive research and mobile UI testing, we found a way to provide physician specific information on which condition they had opportunity for improvement AND the ability to compare themselves to their peers on the clinical conditions where their group had the most opportunity for improvement.
- An individualized “callout” with the DRG showing most room for the physician’s individual improvement.
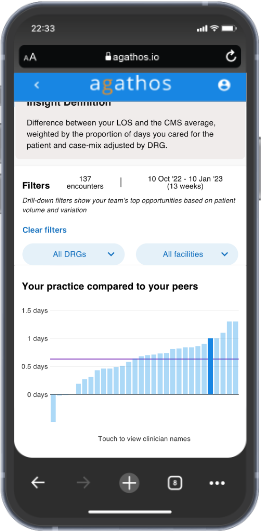
- A filterable peer comparison showing the DRGs with the most opportunity for improvement in the group overall.
The individualized callout
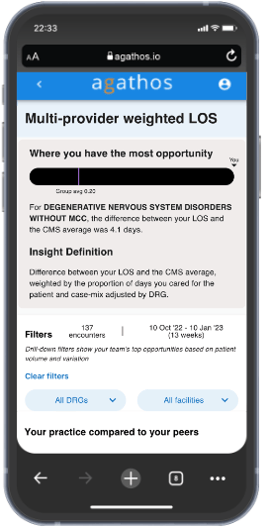
First, we decided to present a mobile-friendly, individualized callout that looks at a physician's specific data, and shows where they personally have the most opportunity for improvement.

We take into account how different each physician is from the DRG average and the number of patients with a specific diagnosis that they see. So if a physician is notably different from the group on one diagnosis, but sees very few patients in that area, we would see that opportunity as a lower priority than for a slightly smaller difference from the group, but with many patients.
In other words, we call out one area for the physician to consider — the one with the most opportunity for them to change based on difference from the group AND the number of patients with this diagnosis that they see on a regular basis.
The drill down
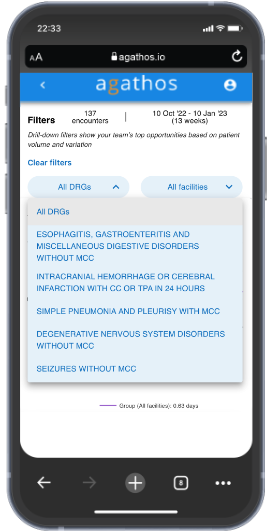
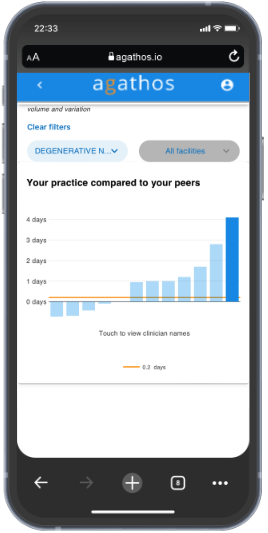
We also allow the physician to see their performance compared to their peers on the DRGs where their group overall has the most opportunity for improvement. Physicians can select a DRG from the filter menu and instantly the broad length of stay metric will be filtered by that DRG. They can explore up to five of the top DRGs for their group using this feature.


Every doc is different
In testing, we found that some physicians really liked the direct, personalized area of opportunity shown in the individualized callout. Others preferred to drill down into the various DRGs to see how they performed in those categories. And many enjoyed both. We found a way to satisfy different types of users even with the limited space available on a mobile device.
Administrators find value
When administrators see a rise in length of stay, they begin to feel the pressure. But what are they to say to the physicians? “Do better!”? That is not helpful. With Agathos’ new approach to drilling down by DRG, administrators now have more specifics to use in conversations about new ways forward — both at the individual and group level.
Moving forward
Having overcome the data science challenges of being both relevant and actionable as well as the user interface challenges of providing meaningful data visualizations with a variety of filters, we can now apply this same framework to other metrics. For example, we can allow physicians to drill down on their Head CT utilization and see their utilization for patients with headache, minor injury, syncope, or dizziness.
That’s why we’re here. To help physicians focus their practice on the most valuable care possible. 
Afterthought: You may find this related video interesting in which Agathos CEO discusses our commitment to physicians.
About Author

Natasha Hagemeyer, PhD
Natasha is a Staff Data Scientist with Agathos and holds a doctorate in ecology. Previously, she conducted research in behavioral ecology. Currently, she leverages her data expertise to identify patterns and insights in healthcare data for improved patient care.
